CanvasJS Charts Logo

CanvasJS Charts

CanvasJS Charts is a high-performance HTML5 JavaScript charting library built on the HTML5 Canvas element. It supports over 30 chart types including line, bar, pie, spline, area, doughnut, and stock charts, enabling developers to create rich, responsive dashboards that render seamlessly across devices such as iPhone, iPad, Android, Mac, and PCs. With a simple and intuitive API, CanvasJS delivers 10x faster performance compared to SVG-based charting libraries, capable of rendering large data sets (100,000+ points) in milliseconds. Trusted by over 500,000 users worldwide, it offers extensive documentation, developer support, and multiple themes for visually appealing data visualization.

platform:web pricing:paid language:javascript form:library form:api feature:high-performance feature:html5-canvas feature:responsive feature:multiple-chart-types feature:support-for-stock-charts feature:well-documented feature:cross-browser-support feature:developer-support target:developers target:teams use-case:data-visualization

Features

High Performance
Html5 Canvas
Responsive
Multiple Chart Types
Support For Stock Charts
Well Documented
Cross Browser Support
Developer Support

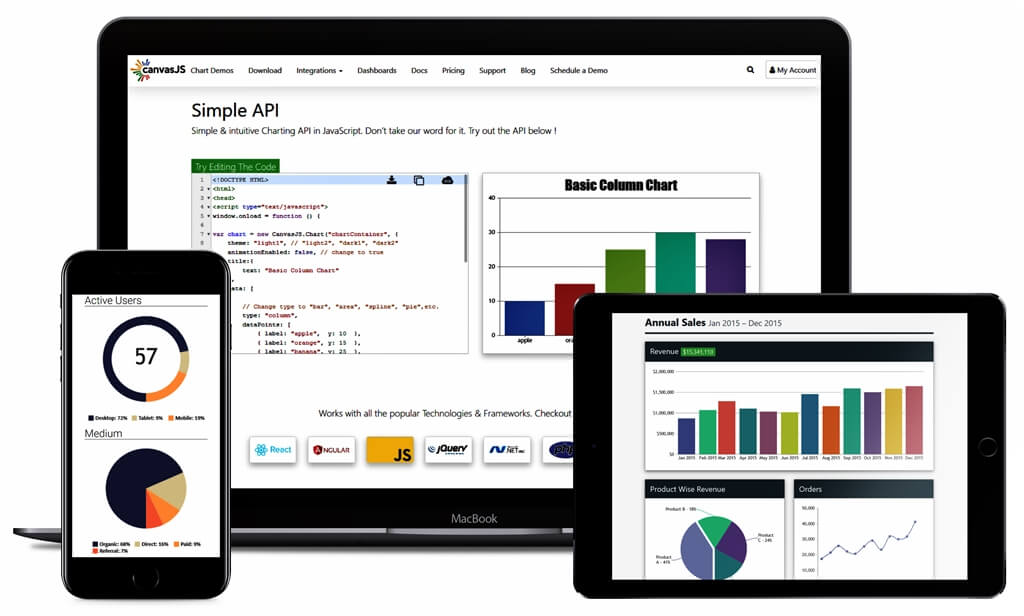
Images & Screenshots

CanvasJS Charts Image

Testimonies

No testimonies available for this tool yet.

Basic Info
  • Category Development
Availability & Pricing
  • Pricing Model
    Paid
  • Details
    Paid
AI Curation
  • Curator Agent updated name, description, category, and 4 more

    26 days ago